You are now viewing a post hoc subset analysis by treatment duration of the MAIA trial. This information is not included in the current Prescribing Information and has not been evaluated by the FDA. No conclusions should be drawn. These data should be understood in the context of the methodology.
- To explore the impact of treatment duration on long-term clinical outcomes, a post hoc analysis evaluated DRd treatment response in 6-month intervals (6, 12, 18, 24, 30, and 36 months).
- Response data presented are cumulative deepest response rates achieved by 6, 12, 18, 24, 30, and 36 months, which included 342 out of the 368 ITT population in the DRd arm and 301 out of 369 patients in the Rd arm.
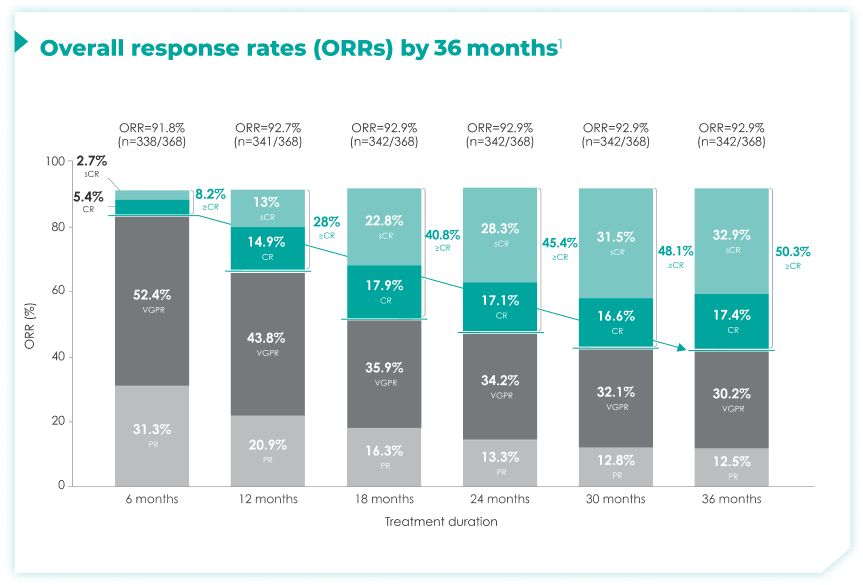
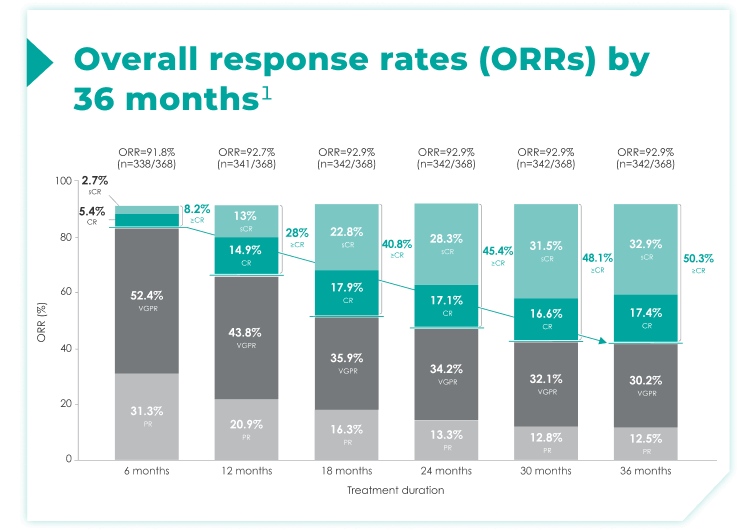
≥CR rates increased over 6, 12, 18, 24, 30, and 36 months of continuous frontline DRd.1
>50% of patients achieved a ≥CR by 36 months of DRd treatment compared with ~8% by 6 months of treatment1
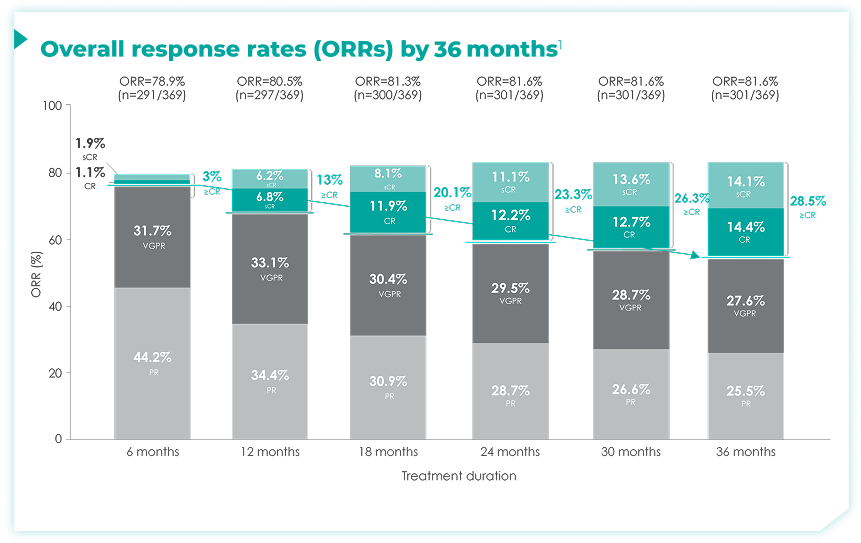
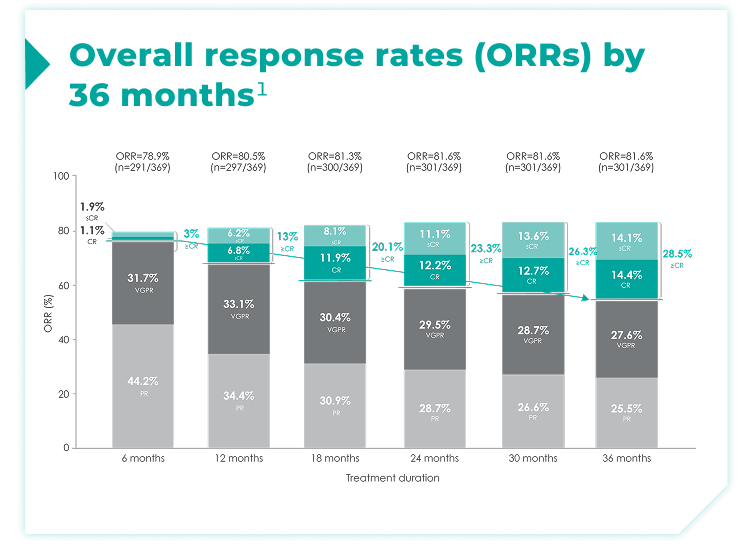
~30% of patients achieved a ≥CR by 36 months of Rd treatment compared with ~3% by 6 months of treatment1
Continuous frontline treatment with DARZALEX® + Rd and patient outcomes
Dr. Suzanne Reim Fanning, Associate Professor at USC School of Medicine Greenville, discusses what the research says about the importance of continuing frontline treatment with DARZALEX® until disease progression or unacceptable toxicity, and how doing so shapes outcomes for patients with multiple myeloma.
You are now viewing a subset analysis by treatment duration of the MAIA trial. This information is not included in the current Prescribing Information and has not been evaluated by the FDA. No conclusions should be drawn. In the following analysis, treatment-emergent adverse events are presented as observed and should be understood in context with the specific methodology.
- Most frequently reported treatment-emergent adverse events (TEAEs) that met the threshold of cumulative any grade TEAE >30% or Grade 3/4 TEAE >10% are presented1
- Combined TEAE rates are the sum of the percentages of the most frequently reported TEAEs, at each cycle period
- Percentages represent number of patients with >1 TEAE by treatment cycle divided by total number of patients treated within the treatment window
- Only TEAEs with onset date falling within the cycle intervals were calculated. Each patient was calculated once per preferred term for each cycle interval. The same patient could be calculated in multiple cycle intervals and for multiple preferred terms. TEAEs may not have resolved by the next cycle
- Decrease in adverse event (AE) rates over time from treatment initiation was observed for most AEs in both treatment arms. Cataract tended to increase over time in both treatment arms (see rates below)1
- 13% of intent-to-treat (ITT) patients discontinued treatment due to a TEAE with DRd (n=364) vs 22% with Rd alone (n=365)2
AEs for DRd across Cycles 1-301
Any TEAE ≥30% or Grade 3/4 ≥10%
Scroll to view data over time
| DARZALEX® once-monthly administration start | |||||||||
|---|---|---|---|---|---|---|---|---|---|
| Any Grade TEAE | Cycles 1-2 (n=364) | Cycles 3-6 (n=348) | Cycles 7-10 (n=330) | Cycles 11-14 (n=312) | Cycles 15-18 (n=299) | Cycles 19-22 (n=285) | Cycles 23-26 (n=271) | Cycles 27-30 (n=259) | |
| Hematologic | Neutropenia | 40.4% | 24.4% | 17.9% | 18.6% | 17.7% | 16.1% | 11.1% | 12.4% |
| Anemia | 17.3% | 10.9% | 8.2% | 6.7% | 4.0% | 6.0% | 5.5% | 7.3% | |
| Leukopenia | 14.0% | 5.7% | 4.2% | 3.8% | 3.0% | 3.5% | 4.1% | 2.3% | |
| Lymphopenia | 13.7% | 4.6% | 3.6% | 4.8% | 5.7% | 4.2% | 4.4% | 3.5% | |
| Nonhematologic | Constipation | 26.4% | 11.8% | 5.5% | 3.8% | 4.0% | 2.1% | 3.0% | 5.0% |
| Nausea | 21.4% | 6.6% | 4.2% | 3.8% | 5.0% | 1.8% | 2.6% | 1.9% | |
| Fatigue | 20.1% | 14.1% | 7.0% | 8.7% | 7.4% | 7.7% | 5.9% | 7.3% | |
| Diarrhea | 15.9% | 15.5% | 15.8% | 16.0% | 18.4% | 17.5% | 14.0% | 10.0% | |
| Dyspnea | 14.8% | 6.6% | 3.9% | 3.2% | 1.7% | 3.2% | 2.2% | 2.3% | |
| Edema peripheral | 14.3% | 12.6% | 7.3% | 7.7% | 6.4% | 6.3% | 4.1% | 4.2% | |
| Cough | 14.0% | 6.9% | 3.9% | 2.9% | 3.0% | 4.2% | 4.8% | 3.1% | |
| Asthenia | 13.5% | 8.9% | 7.3% | 6.7% | 6.0% | 6.0% | 3.7% | 2.7% | |
| Muscle spasms | 13.5% | 9.5% | 2.1% | 5.4% | 2.3% | 2.5% | 2.6% | 1.2% | |
| Back pain | 9.9% | 6.3% | 6.4% | 5.1% | 4.0% | 6.7% | 3.7% | 5.4% | |
| Insomnia | 9.9% | 7.2% | 5.2% | 7.4% | 3.0% | 4.2% | 3.0% | 3.1% | |
| Weight decreased | 9.1% | 12.4% | 4.5% | 3.8% | 1.3% | 2.5% | 1.1% | 1.9% | |
| Hypokalemia | 8.0% | 4.6% | 3.3% | 1.6% | 3.0% | 6.0% | 2.2% | 4.2% | |
| Peripheral neuropathy | 6.3% | 4.0% | 5.2% | 5.4% | 5.4% | 7.0% | 2.6% | 3.1% | |
| Bronchitis | 4.7% | 6.6% | 6.4% | 7.1% | 8.7% | 6.7% | 6.6% | 7.3% | |
| Pneumonia | 4.7% | 6.6% | 3.9% | 4.2% | 4.7% | 5.3% | 3.3% | 2.3% | |
| Cataract | 0.3% | 0.6% | 2.4% | 3.5% | 5.4% | 3.9% | 3.7% | 4.6% | |
| Combined TEAE rates (sum of the percentages) | 292% | 186% | 128% | 130% | 120% | 123% | 94% | 95% | |


| Any Grade TEAE | Cycles 1-2 (n=365) | Cycles 3-6 (n=335) | Cycles 7-10 (n=297) | Cycles 11-14 (n=263) | Cycles 15-18 (n=237) | Cycles 19-22 (n=210) | Cycles 23-26 (n=187) | Cycles 27-30 (n=169) | |
|---|---|---|---|---|---|---|---|---|---|
| Hematologic | Neutropenia | 20.3% | 21.8% | 12.8% | 16.0% | 14.8% | 9.0% | 13.4% | 13.0% |
| Anemia | 19.5% | 16.1% | 8.1% | 8.0% | 10.1% | 5.7% | 3.7% | 5.3% | |
| Leukopenia | 4.4% | 2.4% | 1.3% | 3.0% | 3.0% | 2.4% | 2.7% | 4.1% | |
| Lymphopenia | 7.1% | 5.7% | 2.0% | 3.4% | 1.7% | 1.9% | 0.5% | 3.0% | |
| Nonhematologic | Constipation | 19.7% | 14.0% | 4.0% | 3.4% | 4.2% | 2.4% | 3.7% | 1.8% |
| Nausea | 15.6% | 6.0% | 4.0% | 2.3% | 2.1% | 3.8% | 2.1% | 0.0% | |
| Fatigue | 16.2% | 8.4% | 6.1% | 5.7% | 5.5% | 4.3% | 2.7% | 5.9% | |
| Diarrhea | 15.6% | 15.2% | 12.5% | 12.5% | 15.6% | 14.8% | 9.1% | 12.4% | |
| Dyspnea | 6.6% | 3.0% | 3.4% | 3.0% | 2.5% | 2.9% | 1.6% | 1.2% | |
| Edema peripheral | 11.8% | 12.5% | 6.4% | 3.8% | 5.5% | 6.7% | 4.8% | 4.7% | |
| Cough | 5.8% | 3.3% | 3.7% | 2.3% | 5.1% | 1.0% | 2.1% | 2.4% | |
| Asthenia | 9.6% | 5.7% | 6.4% | 4.2% | 5.1% | 3.3% | 2.7% | 5.9% | |
| Muscle spasms | 10.7% | 6.9% | 5.4% | 3.8% | 2.5% | 3.8% | 2.7% | 1.2% | |
| Back pain | 6.8% | 8.1% | 5.7% | 6.5% | 4.6% | 7.1% | 5.9% | 3.6% | |
| Insomnia | 12.6% | 9.3% | 6.7% | 5.7% | 5.1% | 2.9% | 2.1% | 4.1% | |
| Weight decreased | 7.1% | 6.6% | 2.7% | 1.5% | 4.2% | 2.9% | 1.6% | 1.2% | |
| Hypokalemia | 4.9% | 5.4% | 4.0% | 4.6% | 4.6% | 5.2% | 3.7% | 1.8% | |
| Peripheral neuropathy | 3.8% | 3.6% | 3.7% | 4.9% | 3.8% | 4.3% | 0.5% | 4.1% | |
| Bronchitis | 3.0% | 5.4% | 5.4% | 4.9% | 6.8% | 7.1% | 5.9% | 6.5% | |
| Pneumonia | 3.3% | 4.5% | 3.7% | 2.7% | 2.1% | 1.0% | 1.6% | 3.6% | |
| Cataract | 0.8% | 1.5% | 1.7% | 5.3% | 4.6% | 6.7% | 7.5% | 4.1% | |
| Combined TEAE rates (sum of the percentages) | 205% | 165% | 110% | 108% | 114% | 99% | 81% | 90% | |

